
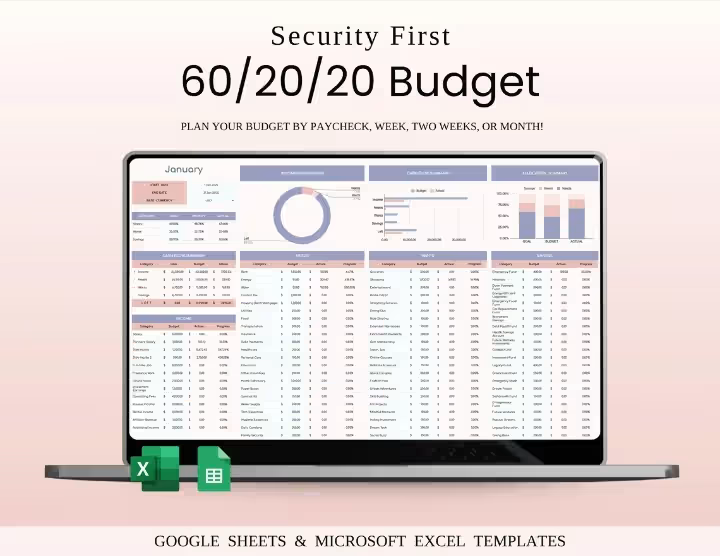

60/20/20 Budget Spreadsheet Monthly Template
Take control of your finances with the 60/20/20 Budget Spreadsheet for Excel & Google Sheets. Auto-allocates income into needs, wants & savings with visual dashboards and simple setup. Perfect for individuals, families & freelancers. Instant digital download.
Original price was: $25.00.$14.90Current price is: $14.90.
Product ships
Instant delivery. Your files will be available to download once payment is confirmed.
Safe checkout
The payment is handled via our partner & we don’t store any credit card information.
100% privacy protected
Your data will not be sold to other companies & we will never spam you with nonsense.
About this item
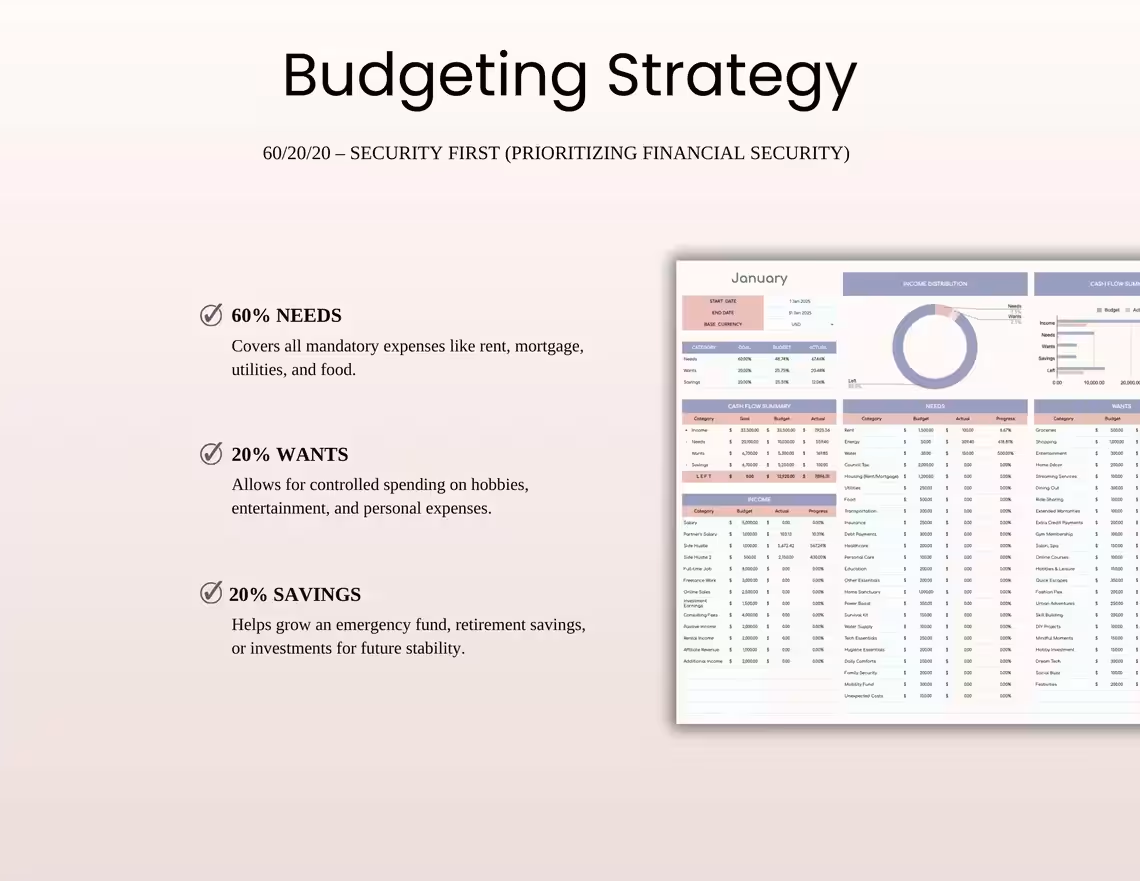
💰 Prioritize What Matters Most — And Build Real Financial Security
Most budgeting systems treat needs, wants, and savings equally. But life isn’t equal. For many people — especially those with higher living costs, growing families, or serious savings goals — essential expenses take up more than half of their income.
The 60/20/20 Budget Spreadsheet was built for exactly this reality.
By dedicating 60% of your income to needs, 20% to wants, and 20% to savings — this proven framework gives you a stable, realistic foundation that prioritizes financial security without sacrificing everything you enjoy.
Just enter your income. The spreadsheet handles the rest.
💡 WHY THIS SPREADSHEET STANDS OUT
✅ Auto-allocation — income entered once, everything updates instantly
✅ Beginner-friendly — no formulas to figure out, just plug in numbers
✅ Visual dashboards — charts and graphs for instant financial clarity
✅ Variable income support — works for freelancers and hourly workers
✅ Excel & Google Sheets — access anywhere on any device
✅ Works solo or with a partner — flexible for any household setup
✅ Fully customizable — rename or add any category to match your life
✅ One-time purchase — no subscription, use forever
🔢 HOW THE 60/20/20 RULE WORKS
🏠 60% — Needs
The largest allocation goes to the essentials — the non-negotiable costs that keep your life running every single month.
Includes:
- Rent or mortgage payments
- Groceries and household essentials
- Utilities — electricity, gas, water, internet, phone
- Transportation — car payments, fuel, public transport, insurance
- Health insurance and essential medical costs
- Minimum debt payments
- Childcare and essential family costs
The 60% needs allocation reflects the reality that for many households essential costs genuinely consume the majority of income — and budgeting around that reality rather than against it is what makes this framework sustainable.
🎉 20% — Wants
A dedicated 20% for the things that make life enjoyable — guilt-free, intentional, and within a clearly defined limit.
Includes:
- Dining out and food delivery
- Entertainment — streaming, cinema, events
- Shopping — clothing upgrades, gadgets, home décor
- Hobbies and recreational activities
- Travel and weekend getaways
- Subscriptions and personal care
The 20% wants allocation is what makes this budget livable long-term. You don’t have to give up the things you love — you just spend on them intentionally.
💎 20% — Savings & Financial Goals
A powerful 20% dedicated entirely to building your financial future — consistently and automatically.
Includes:
- Emergency fund — 3 to 6 months of living expenses
- Debt repayment above the minimum
- Retirement savings and pension contributions
- Investment portfolio — stocks, index funds, and assets
- Short and long-term savings goals
- Sinking funds for planned future expenses
A consistent 20% savings commitment — month after month — is the foundation of genuine long-term financial security.
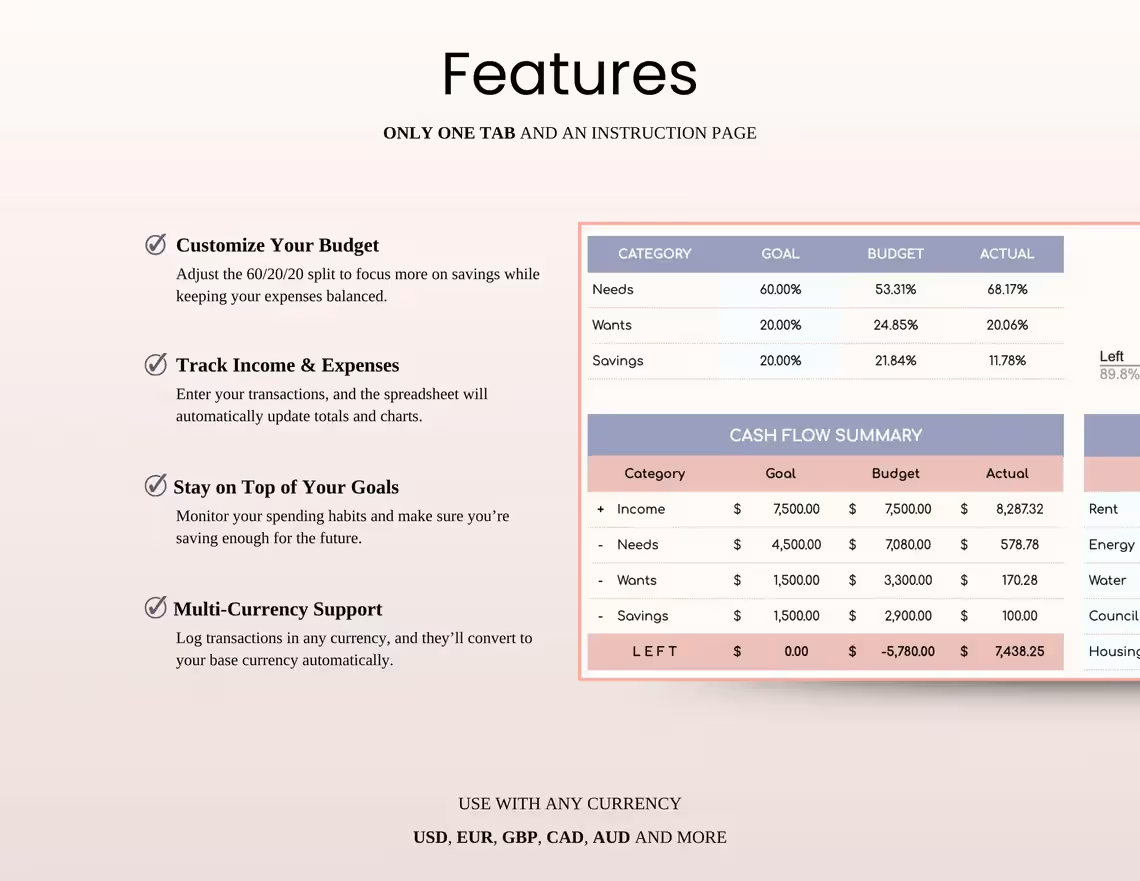
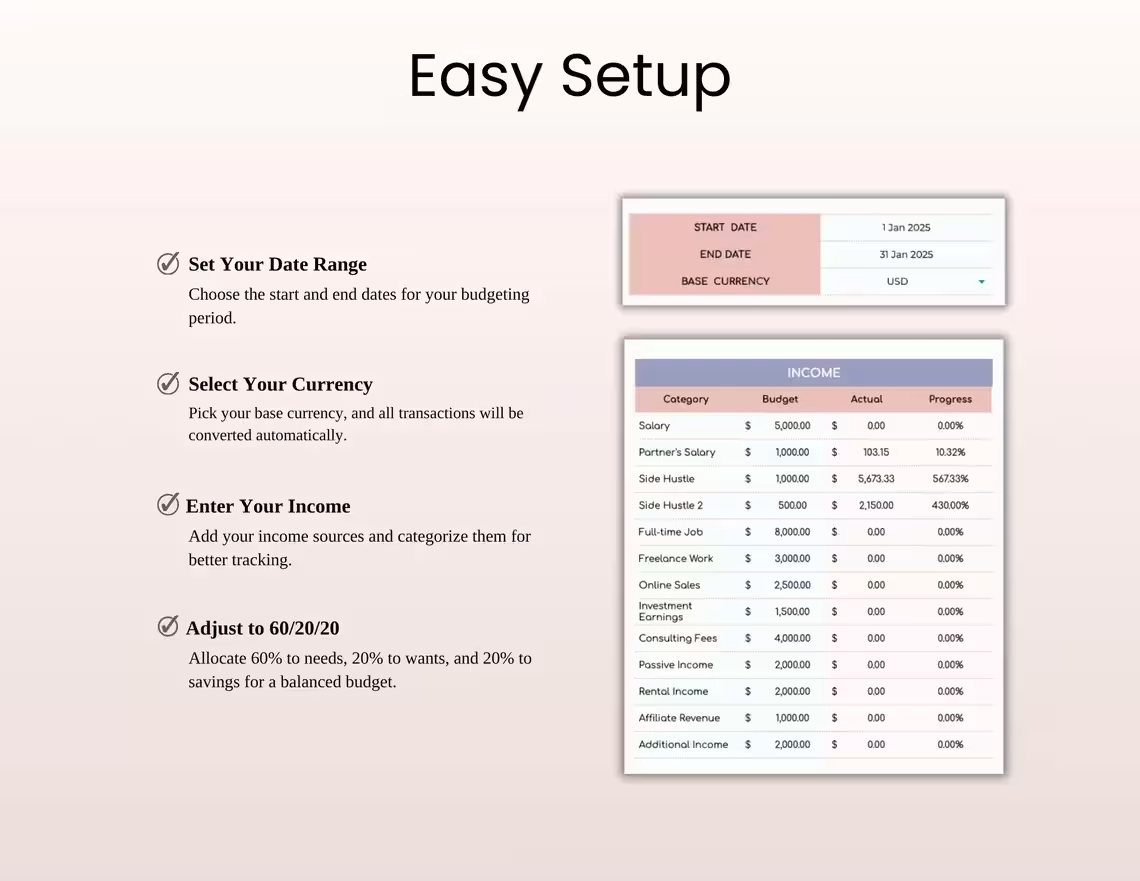
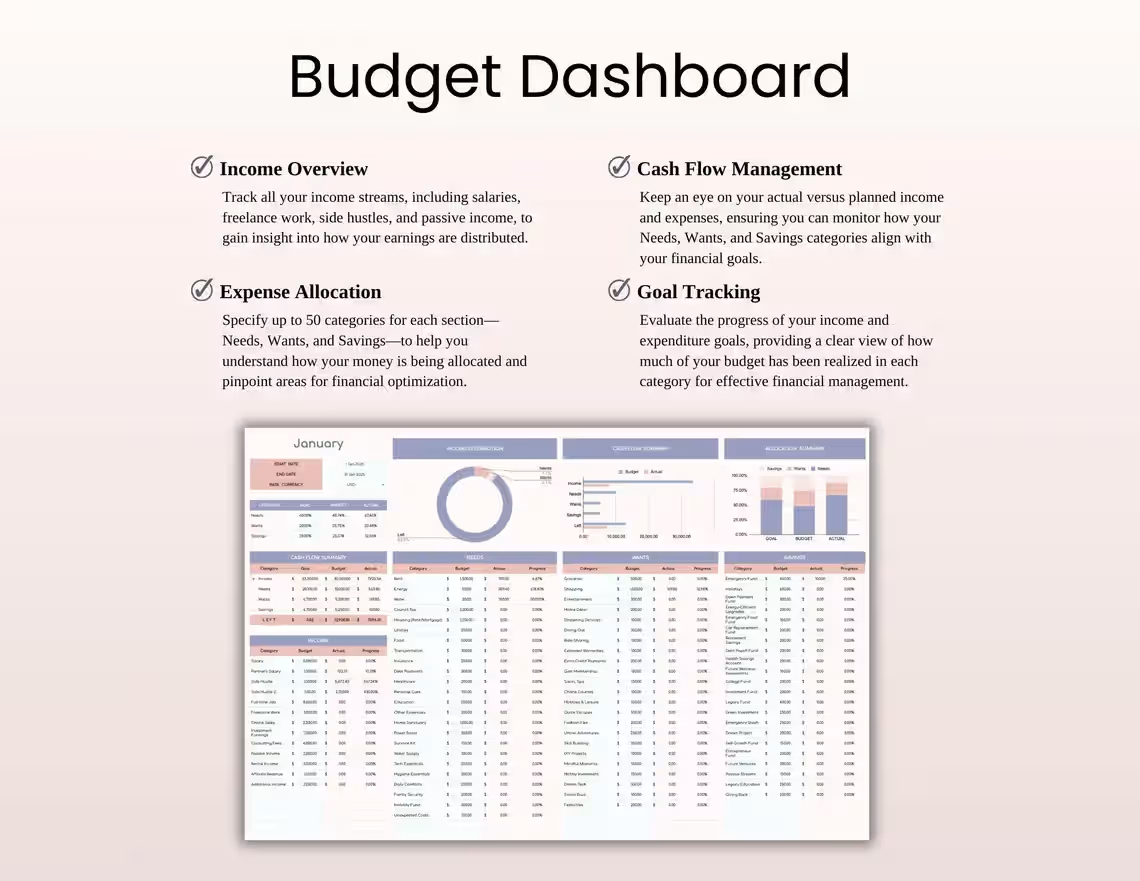
🗂️ WHAT’S INSIDE THE SPREADSHEET
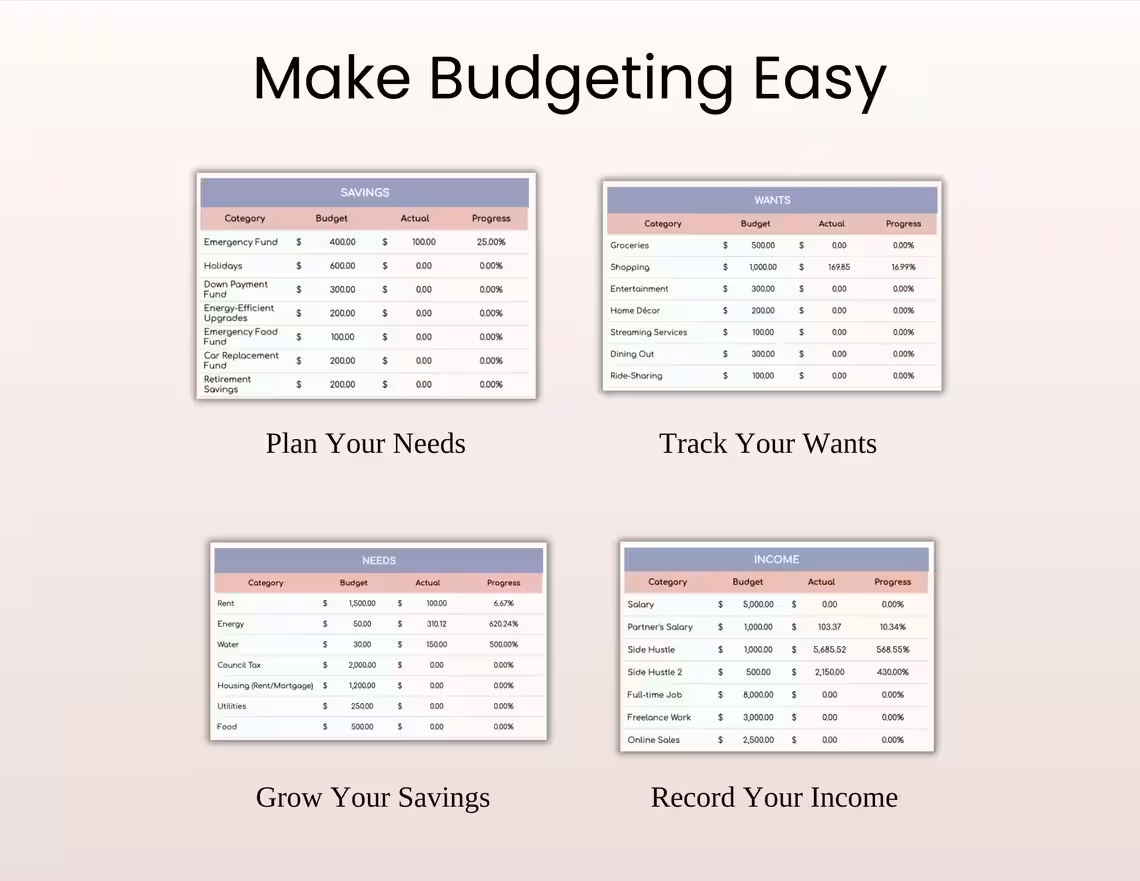
Income Input Section Enter your monthly take-home income once and every allocation updates automatically. Supports multiple income sources and variable income for freelancers and self-employed users.
Needs Tracker — 60% Pre-built categories for every common essential expense. Color-coded status indicators show whether you’re on track, approaching your limit, or over budget in real time.
Wants Tracker — 20% Track all discretionary spending with a live remaining balance so you always know exactly how much wants budget you have left for the month.
Savings & Goals Tracker — 20% Track your emergency fund, debt payoff progress, investments, and individual savings goals — all with visual progress indicators to keep you motivated.
Visual Dashboard & Charts
- 60/20/20 allocation pie chart
- Actual vs budget comparison chart
- Monthly spending trend line
- Category breakdown charts
- Savings progress trackers
- Income vs expenses overview
Monthly Summary Page A one-page snapshot of your complete financial picture — income, spending, savings, and monthly surplus or deficit — at a glance.
📦 WHAT YOU’LL RECEIVE
Instant digital download containing:
- Excel version (.xlsx) — for Microsoft Excel on Mac and PC
- Google Sheets version — copy directly into your Google Drive
📌 Digital product — no physical item shipped. All sales final.
Financial security isn’t about earning more — it’s about managing what you have with clarity and intention.
Related products
-
Sale!

Ultimate Google Sheets Budget Template for Better Money Management
Original price was: $10.00.$7.00Current price is: $7.00. -
Sale!
Net Worth Tracker Template | Asset & Liability Tracker
Original price was: $25.00.$13.00Current price is: $13.00. -
Sale!
Annual Paycheck Budget Spreadsheet For Whole Year
Original price was: $49.00.$24.90Current price is: $24.90. -
Sale!
Ultimate Annual Budget Spreadsheet for Individuals, Families & Small Business
Original price was: $41.00.$24.90Current price is: $24.90. -
Sale!
Simple Budget Planner – Green Theme | Monthly, Weekly & Biweekly
Original price was: $25.00.$14.90Current price is: $14.90. -
Sale!
Bill Tracker Spreadsheet | Monthly Bill Organizer & Due Date Calendar
Original price was: $23.00.$12.90Current price is: $12.90. -
Sale!
Bill Payment Calendar For Personal & Small Business
Original price was: $23.00.$12.90Current price is: $12.90. -
Sale!
Airbnb Income and Expense Tracker | Vacation Rental Finance Spreadsheet
Original price was: $60.00.$24.90Current price is: $24.90.
Dena Hayes –
Learning to use it is challenging but the resources for helping with that are readily available.
Andrea –
This has changed the budgeting game for me. It is EXTREMELY easy to use and makes any headaches associated with personal finance go away.
Melody –
I am pleased with my product and all the other little extras it came with.
Sandy Frye –
In love!!! Been yearning for a proper budget sheet that’s this comprehensive and data focused approached, genuinely obsessed!!!
Caroline –
This Spreadsheet Combo has EVERYTHING! I love it. I use it every day and for the first time in my entire life I have managed to maintain a budget and plan with my finances. Highly recommend
Alphonso Werner –
I haven’t totally set it up yet but what I have done, I really love it.
Elsa Rogers –
This is very detailed – we are excited to fill in all the things so we can really SEE what we’re doing.
Danielle –
I have searched so long for something that was this thorough. Thank you for creating such an amazing product.